Facebook Prophet for Time-Series Machine Learning
Time-series data consists of records in chronological order and is crucial for forecasting trends and patterns. In this blog, we take a look at how to use Facebook Prophet for time-series forecasting.

Introduction
Any data which has a sequence of records in the chronological time order can be referred to as time series data. It is the most natural form of storing data for many situations, like recording the sales transactions at a Target outlet, web browsing information on devices and so on. The time-series data can be used to discover underlying patterns, trends and make more accurate forecasting for future time periods. Time-series forecasting has a wide variety of applications including prediction of stock market fluctuations, weather patterns, agricultural sales and much more. In this blog we guide you through an example of how to use Facebook Prophet for time-series forecasting.
Understanding Time-Series Data
Time-series data also has certain unique characteristics unlike the regular tabular data. It’s crucial that we understand these terms and how they differ. Let’s take a quick look!
-
Trend: The long term patterns observed in the data over the time is called a trend. For example, sales of smartphones show an increasing trend over the years, while sales of hardcopy books show a decreasing trend.
-
Seasonality: The changes in the data that occur in periodic cycles or seasons are referred to as seasonality. Note that they aren’t long term changes, but cyclical. For example, the sales of jackets increasing during winter and dropping during summer is a seasonality.
-
Noise: No dataset collected is perfect! There would be irregular fluctuations in the data due to errors during data collection or storage which are denoted as noise. It is essential to remove the noise from the data, else it may obscure the underlying patterns.
Auto-correlation: In time series data, if the value of a datapoint at a specific time depends upon the values at previous timestamps, the phenomenon is referred to as auto-correlation. It can help us to capture dependencies within data while forecasting.
What’s Facebook Prophet and Why should you use it?
From the previous section, we understood the necessity for accurate time-series forecasting. There are multiple packages and models available for time series analysis, but Facebook Prophet stands out due its robustness and user-friendliness.
Facebook Prophet is an open source library developed by the data science team of Facebook (Meta). It uses an additive regression technique, where it breaks the data into components like trends, seasonality, holidays. Let's look at the advantages it provides:
-
Facebook Prophet is easy to understand and implement, can be used for time series analysis by businesses that don’t have an expert data science team.
-
It’s a robust model that can handle missing values, noise and outliers in the data.
-
Provides a convenient way to add custom features to capture the effects of seasonality and holiday patterns.
Forecasting Time Series Data with Facebook Prophet
Install Facebook Prophet and Set up Dataset
In this article, We will give you a stepwise walkthrough on how you can use Facebook Prophet to create and construct features for time-series analysis. The following commands were run on a collab notebook. We can start by installing the python package with the below command.
We will be working with Grocery sales forecasting data that is available on Kaggle. You can access it here. This data has a compressed file ‘transactions.csv.7z’ file, which we can unzip and read into a pandas dataframe as shown below.
Your dataframe would look like this: The ‘date’ column is the day for which a sale was recorded, the ‘store_nbr’ denotes the store ID of the merchant and finally the number of transactions.
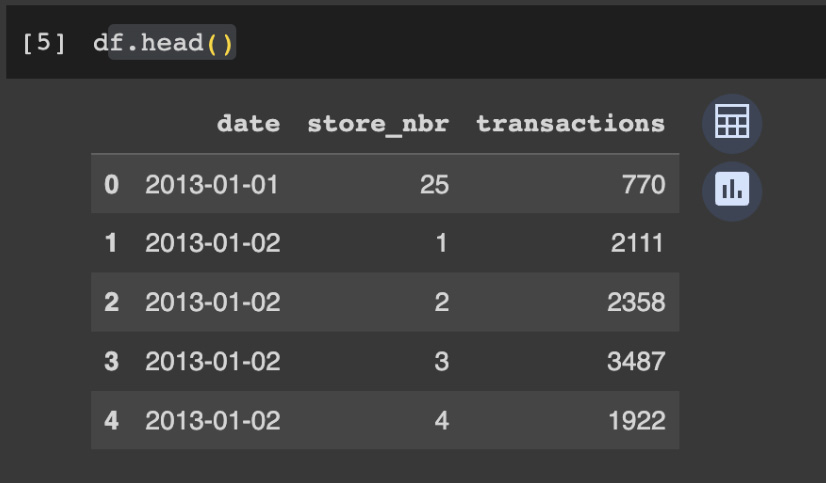
Figure 1: Dataframe: date, store ID and transactions
Our aim here is to apply time-series forecasting and predict the transactions for future dates.
Pre-process & Prepare the Dataset
In the dataset, the transactions are currently grouped by store ID for each day. The first step here is to get a day-wise transaction count across all the stores. Then, we can use packages like Plotly to visualize the number of transactions across the months.
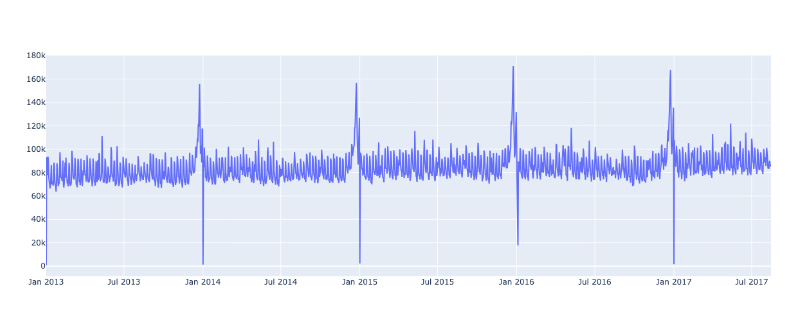
Figure 2: Spikes in transactions plot
From the above plot, we can see the spike in transactions around the New year , keep this in mind as we will see later on how the model interprets this information.
Next, Facebook Prophet always expects input in the form of two columns:
- ds: This column should contain the timestamp
- y: This is the target column with numeric data, which we aim to forecast (No of transactions in this case)
So, let’s convert our data into this format.
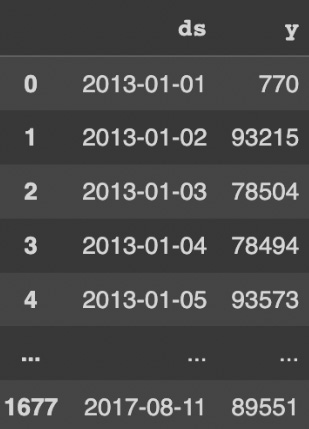
Figure 3: Correct data format
Now, our data is in the right format! Let’s initialize a Facebook Prophet model and see how to fit it using our dataframe.
This is the process of fitting a simple model using our raw data. But, to get more accurate results, we would need to add more features.
Construct features with Facebook Prophet
This is the most crucial and interesting part, where we leverage Facebook Prophet’s inbuilt functions to add features to our model to include the effects of changing seasons, holidays, etc. Let’s see what are the different components and how we can create them.
Trend Components:
Facebook Prophet allows us to customize the trend component to our needs through the ‘growth’ parameter. It has two options: linear(default) and logistic, you need to make the choice based on your data.
How do you choose the trend component? If your data shows a consistent linear trend, and there is no limit on the values that can be reached, go with ‘linear’. If your data follows an S-shaped pattern and the values are bounded, choose logistic growth. In our case, we should go with ‘linear’.
Another important parameter of trend component is the ‘changepoint_prior_scale’. This is used to control the flexibility of the trend, to avoid overfitting or underfitting.Here’s how you can define it in your Prophet model:
The default value is 0.05. You can set it to smaller values like 0.01 for conservative a approach, and higher values like 0.5 to add flexibility and detect changepoints.
Seasonal Effects:
Seasonal effects vary depending upon the type of your business. Prophet automatically detects yearly and weekly seasonalities, but allows providing an option to include custom seasonalities using the 'add_seasonality' method. Let’s add a monthly seasonality component to our model for a period of 30 days.
Holiday Effects:
Holidays impact the number of sales significantly, due to increased purchase during that holiday time period. The relevant holidays would differ from business to business. In the case of a grocery store, the spike in purchases can be expected during time periods like Christmas, thanksgiving, New Year etc..
Prophet allows you to define a custom set of holidays, and add them to the model using the ‘holidays’ parameter.
The ‘lower_window’ and ‘upper_window’ parameters define the time period prior & post to the actual holiday, where the impact can be noticed. For example, many people may purchase groceries 2-3 days prior to Christmas, so we want to include this effect in our model.
External Regressors:
If you have additional data relevant to this, you can add them as external regressors. For example, if you have information on whether a sale happened on a weekend or weekday, you can store it in a dataframe and pass it using the 'add_regressor' function.
This is a very helpful feature in many business applications.
We can also imagine adding data related to weather. In fact, rain could be a factor that indirectly increases or decreases sales for certain products. Yet, for this particular case, we should be careful about what to use as future values. Keep in mind that our task is to forecast future sales given historical data and some external factors or regressors. That means knowing the future is compulsory in order to make accurate forecasts. In this situation, if interested in a short term forecast then we could use some weather prediction data to fill our predictor, but if we are dealing with a longer term forecast then maybe we should think about how to fill and assess whether this could add noise to our model. In that case looking for another external regressor could be more interesting to evaluate.
Once you add all the features as needed, the model is ready to be trained on the data.
Model Building & Time-Series Forecasting with Facebook Prophet
Let us also create a test dataset for the future time-period, for which we will predict the forecast. Facebook Prophet provides a convenient way to extend the historical data for a specific time period through the make_future_dataframe function. The time period can be provided as input through the parameter ‘periods’. For this, let’s first initialize a prophet model with default setting and fit it on our dataframe. Next, we call the function on it to create the future dataframe for next year (365 days). The predict() function can be called on the model passing the test data to generate the forecast.
The generated forecast will have many columns as shown in the below output. We will go over the significant ones:
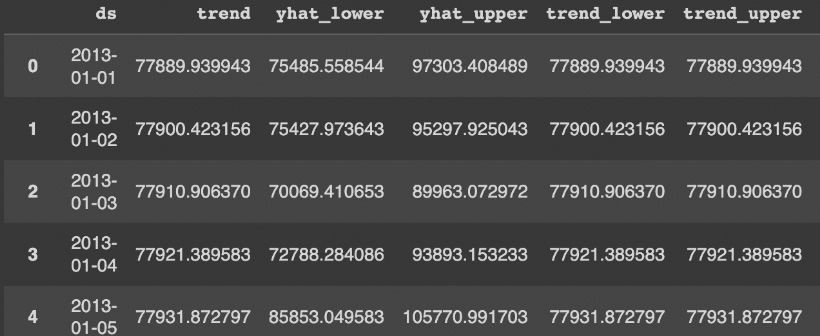
Figure 4: Output from generated forecast
- yhat: This column has the predictions for the number of transactions for the future timestamps.
- yhat_lower: Prophet also takes into account the uncertainty levels while making predictions. This represents the lower bound of the uncertainty interval for each forecasted value.
- yhat_upper: This column represents the upper bound of the uncertainty interval for each forecasted value.
- trend: This represents the estimated trend component of the forecast, the overall direction of growth.
The forecast also provides lower and upper bounds of the trend component. You can create a plot to visualize the original data against the predictions, along with the lower bound and upper bound.
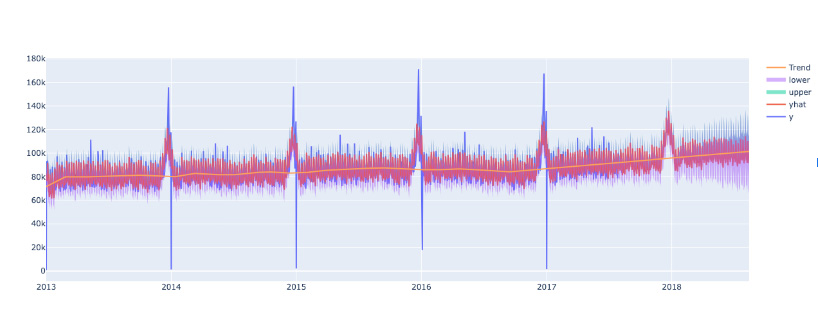
Figure 5: Plot visualizing the original data, predictions data together with lower bound and upper bound.
To evaluate the model, we use RMSE (Root Mean Square Error). This metric denotes the squared deviation between the true labels and the predictions.
Visualization of Feature Components
Now that we have included all the features and trained it on the transactions data, we can visualize the components. Prophet provides an inbuilt function plot_components which you can use.
You can see the trend of the grocery sales forecast across years in the below figure. We can observe a linearly increasing trend in the volume of sales.
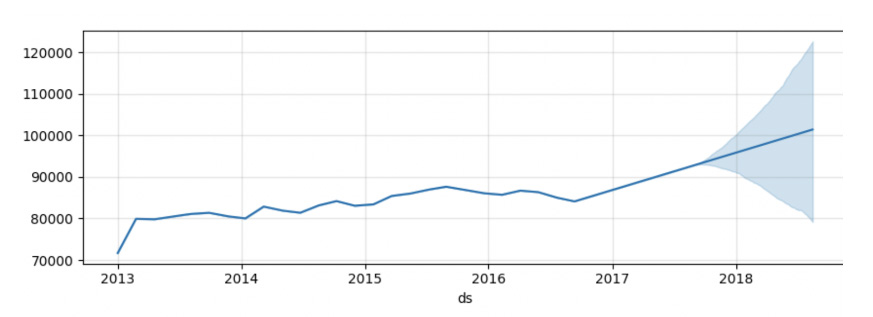
Figure 6: Plot of the trend component of forecast
Next, we have the weekly seasonality plot in the figure below. You can observe a spike in the volume of sales during Saturday and Sunday, as many people might shop in bulk during this time.
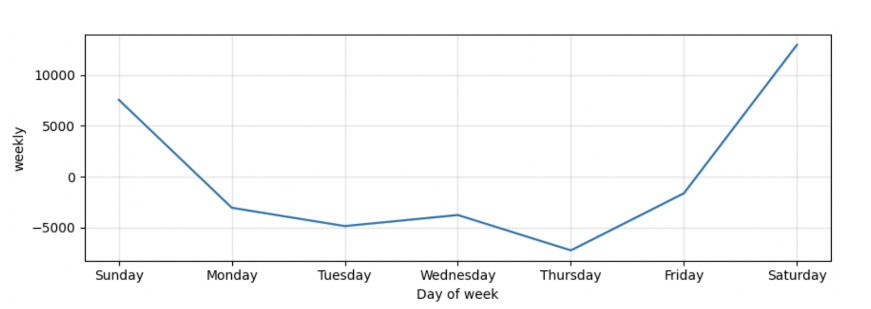
Figure 7: Weekly seasonality plot
As we provided monthly seasonality as a feature, we have the variation of sales across the dates of the months in the next figure. The volume of sales is the highest in the beginning of the month.
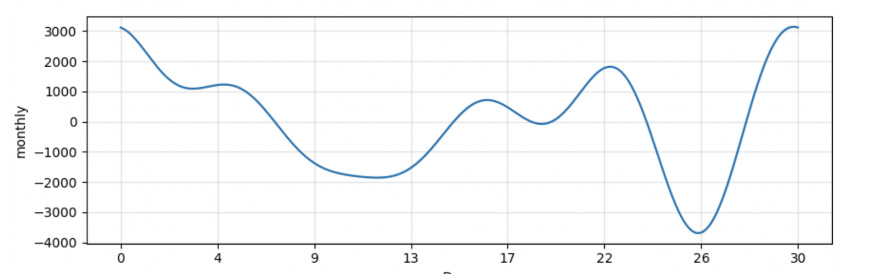
Figure 8: Monthly seasonality plot
Using the visualization of the forecast components, we can derive insights on customer behavior patterns. Actually, here we can think that some customers have a tendency to do monthly shopping on the last weekend of the month or beginning of the next one. So, businesses can stock up for higher demand during the initial and end days of the month, and during the weekends.
Note that we gave some examples of features that could help the model learn sales patterns. In real life scenarios, a significant amount of a data scientist's work consists of crafting features that bring valuable information to the model. Particularly, when dealing with sales in a grocery promotion such feature data can be very interesting to incorporate.
Summary
Throughout this article, we saw the end-to-end pipeline of how to fit a Facebook Prophet model and construct features for time series data. The ability to add custom holidays, seasonality based trend variables, these were examples of features that we can build and use making it convenient to use Facebook Prophet as a time-series forecasting tool. Finally, you need to keep key business aspects in mind when creating features.
Additional Resources
If you are interested to learn more about the theory and applications of Facebook Prophet, you can check out these resources :
- The official documentation of Facebook Prophet released by Meta: http://facebook.github.io/prophet/docs/quick_start.html
- Practical Implementation best practices: https://www.artefact.com/blog/is-facebook-prophet-suited-for-doing-good-predictions-in-a-real-world-project/