Model analysis on the What-If framework for TensorFlow on Hopsworks
We introduce how to use the What-If Tool as a Jupyter plugin on Hopsworks to build better machine learning models by making it easier to ask counterfactual questions about your model’s behaviour.
Model interpretability is concerned with understanding what a machine learning (ML) model does exactly, including pre- and post-processing steps, and how it behaves for different inputs (for example, does this model have a bias if I only use input data for users of a particular gender). Model interpretability is also among the essential skills for every data scientist to decide on whether a model is robust enough and has low enough risk to be deployed in production.
A tried and trusted approach to understanding model behavior is to ask counterfactual questions of the model. That is, you can use slices of your test data to frame “what if” scenarios. Traditionally, this would involve writing a lot of custom functions and throw-away code to analyze a given model. The What-If Tool (WIT) on Hopsworks facilitates data scientists as well as non-programmers to assess the predictions of an ML model. It does this by providing an interactive visual interface for exploring the performance of a model in hypothetical situations, analyzing the importance of different features, and visualizing model behavior across multiple models and slices of input data.
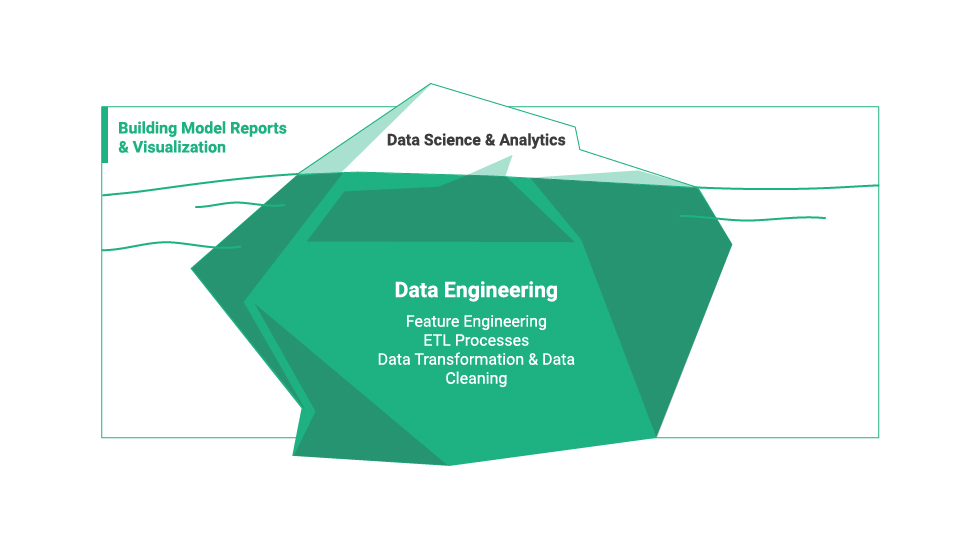
Figure 1. Model development is just one part of the work that goes into an ML project.
What is Model Analysis?
Interactive model analysis is an analytical method that allows looking at how a model would react to certain assumptions. The analysis is very important for users to efficiently solve real-world artificial intelligence and data mining problems [1]. In simple terms, it is the process of understanding, diagnosing, and refining an ML model with the help of interactive visualization and it is an important step before deploying a model to production.
What-If framework for Model Analysis
Hopsworks supports Google’s What-If Tool (WIT) as a Jupyter plugin. It provides an interactive visual interface for expanding understanding of any python-accessible ML model in a Jupyter notebook environment using just a few lines of code. WIT is available out of the box when working within a Hopsworks project because it allows you to easily change the values of the input parameters in a model and see how it affects the outputs. The tool can be accessed directly in a Jupyter notebook in Hopsworks or on an external Colab notebook. WIT is currently not supported in Jupyterlab.
How to start classic Jupyter from the new Hopsworks UI
Below you can see the code snippet used to perform model analysis for the linear classifier on the UCI census problem (predicting whether a person earns more than $50K from their census information). Users set the number of data points to be displayed, the test dataset location to be used for the analysis of the model, and the features to be used
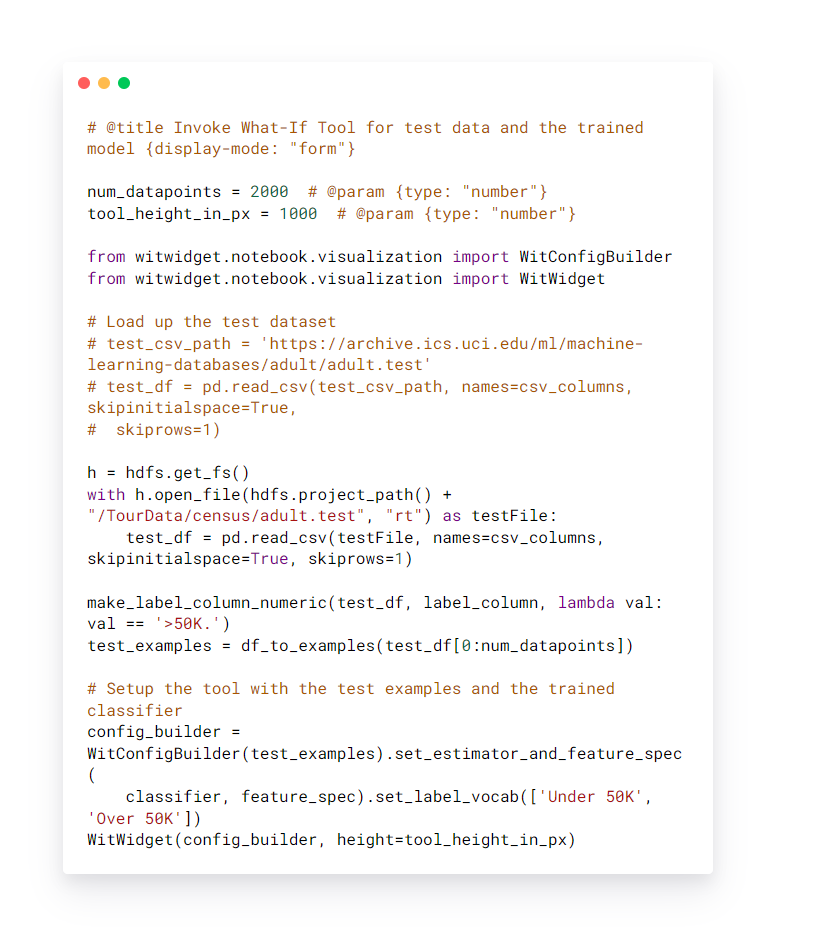
Figure 2. Model analysis What-If Tool code snippet.
We then use WIT to visualize the results of the trained classifiers on test data.
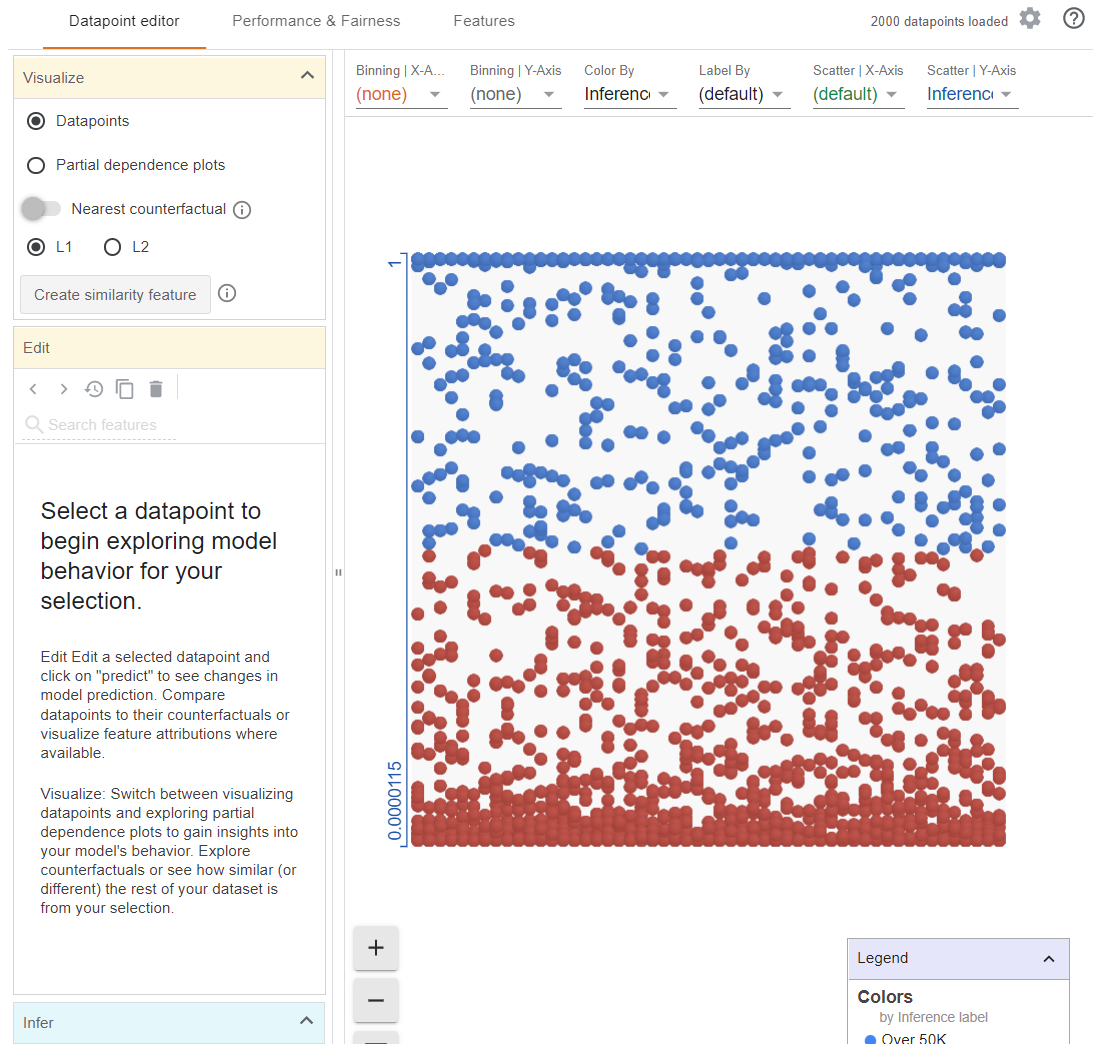
Figure 3. An overall first look at the What-If Tool in Jupyter.
A screenshot from above shows that WIT has three tabs with different features:
- Datapoint editor
- Performance & Fairness
- Features
The initial view is the Datapoint editor that lets you interactively explore your training dataset, changing its values and seeing how this affects your model’s predictions for each datapoint. For example, if I change the value of this datapoint from 0 to 1, what happens?
Some common metrics for our models, such as a confusion matrix, and the ROC curve, can be shown by the next tab: Performance for multi-class and regression models or Performance and Fairness for binary classification models [2]. Also, WIT allows the user to slice data by various feature values and apply various fairness strategies [3].
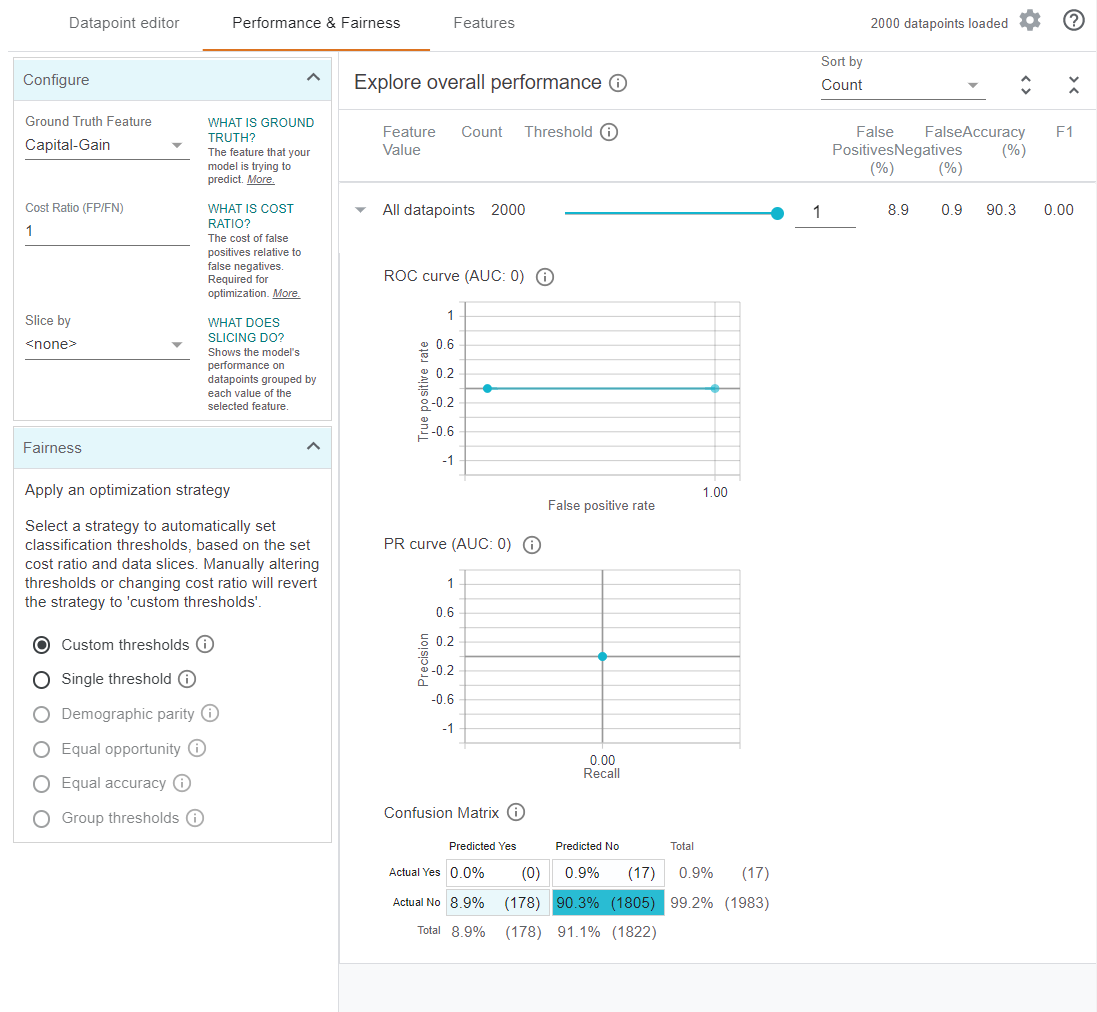
Figure 4. An overall look of the Performance & Fairness tab in the What-If Tool in Jupyter.
The last tab provides the Features Overview workspace, where the distribution of each feature in the loaded dataset is visualized with some high-level summary statistics. It shows how balanced our dataset is, how many null values we have per feature in the dataset. For each feature, we can see the range of values for any data that has been saved into Hopsworks [4]. The features tab can be used for data analysis and summary with only the dataset even before you trained a model. Note, that there is a practical limit to how big the dataframe you visualize is here. Anything larger than a couple of hundred MB (assuming you have a decent workstation) will be too slow. If your dataset is too large, we recommend you subsample your data with Pandas.
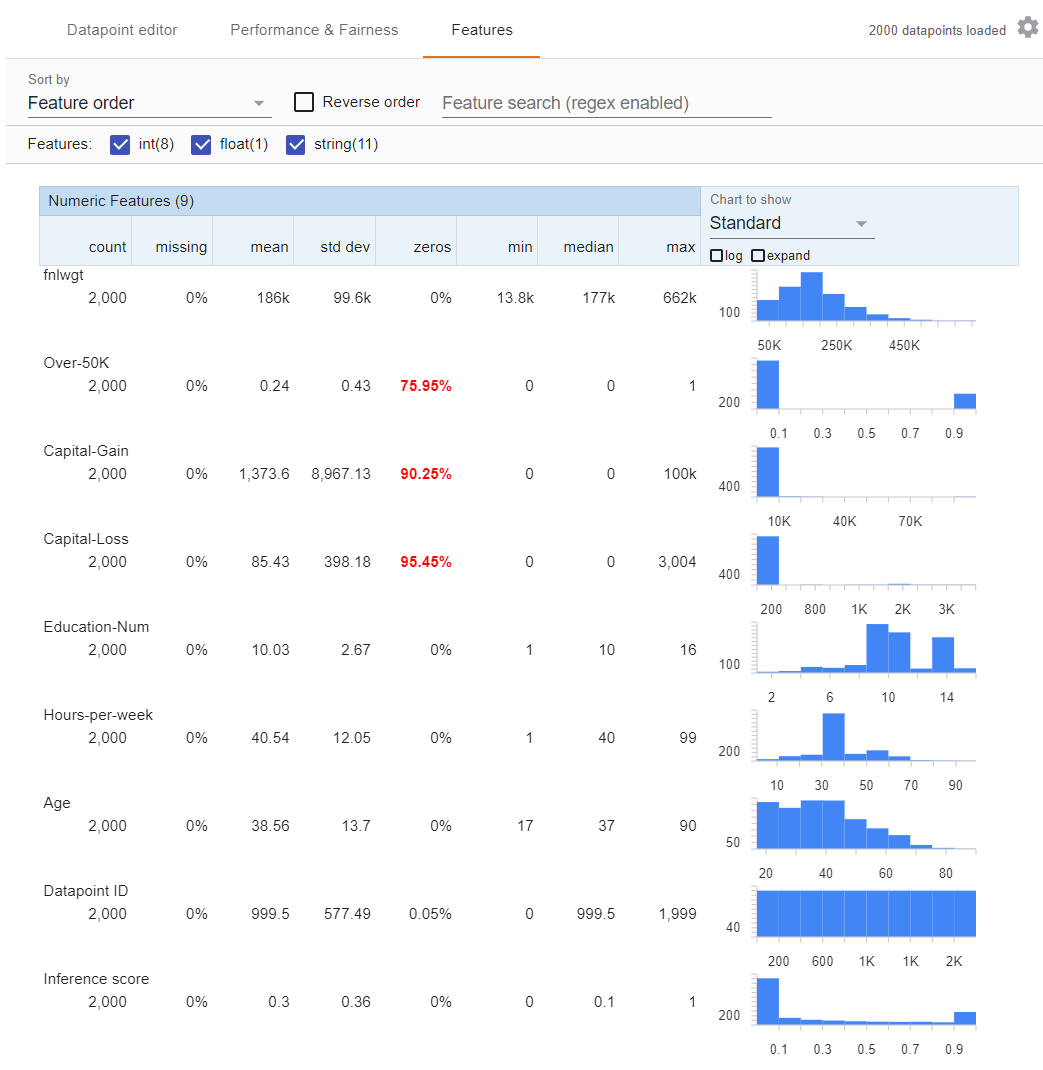
Figure 5. An overall look at the Features tab in the What-If Tool in Jupyter.
Summary
The purpose of using the What-If framework on Hopsworks is to give developers a simple, intuitive, and powerful way to explore and investigate trained ML models through a visual interface with minimal code required. With the What-If Tool framework on Hopsworks, you can perform inference on a large set of examples and immediately visualize the results in a variety of ways. What-If Tool could even help compare two models. Examples can be edited manually or programmatically and re-run through the model to see the results of the changes. Additionally, it contains tools for investigating model performance and fairness over subsets of a dataset.
Get started
What-If Tool is a powerful tool for exploring trained ML models and a great way to get started with hopsworks.ai with this Jupyter notebook.